SLA Management
& Reporting
Real-time dashboards. Pre-breach alerts. Monthly reports with commentary. Automatic service credits. Accountability isn't something we talk about — it's built into every contract.
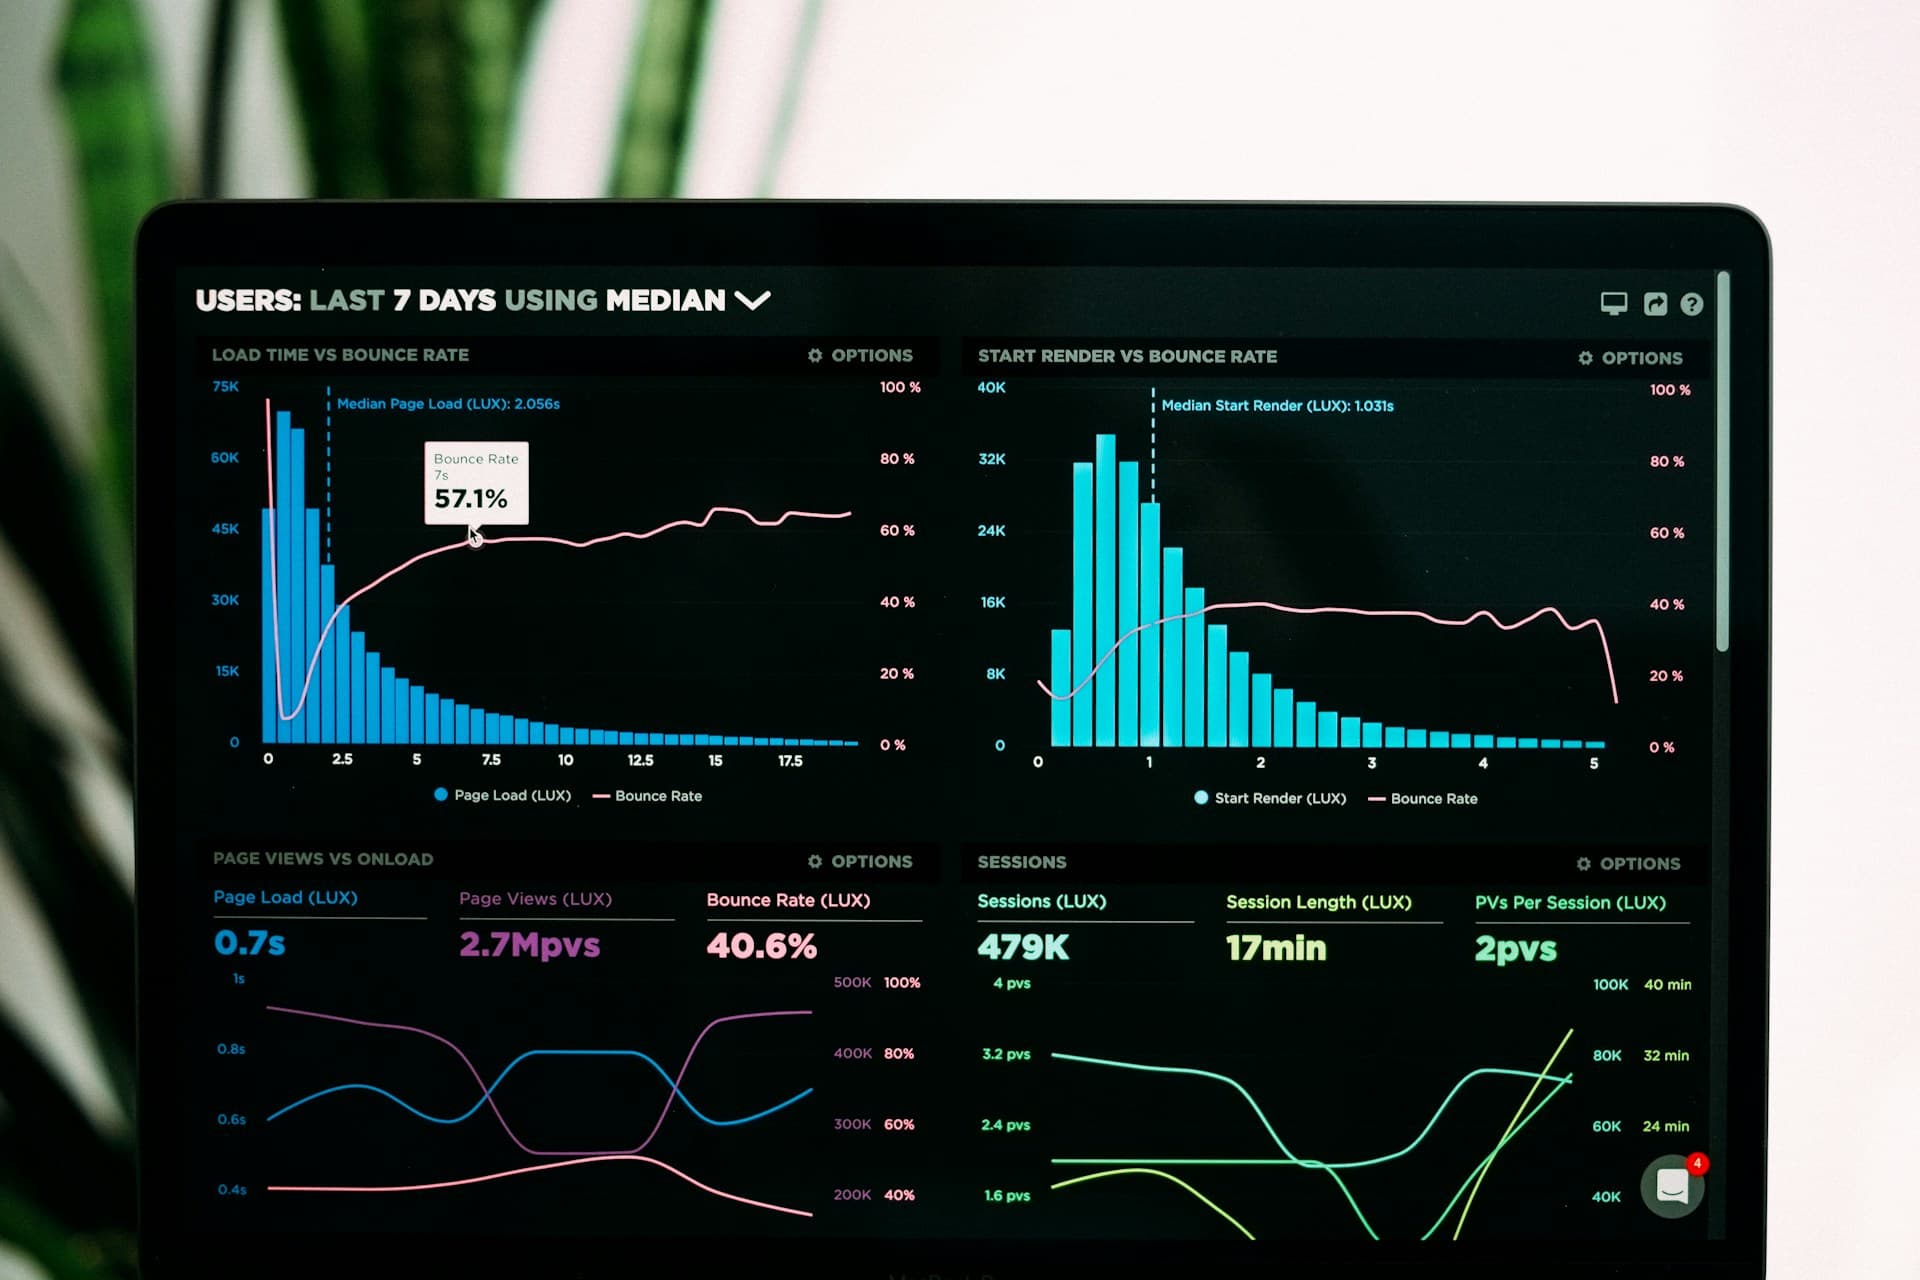
Real-time
SLA dashboard
Live, not daily snapshots
75%
Pre-breach warning
Alert before it's too late
Monthly
Service report
Delivered first Monday
Auto
Service credit calc.
No manual claim required
Five Priorities. Written Commitments.
Every ticket is categorised at intake. Every category has a contractual response and resolution target. No ambiguity.
Priority
Response
Resolution
Service Credit
Definition
15 min
4 hr
10% / breach
Total system failure, business-wide impact
30 min
8 hr
5% / breach
Significant impact, workaround unavailable
2 hr
24 hr
2% / breach
Partial impact, workaround available
4 hr
72 hr
Nil
Minor issue, cosmetic or informational
1 day
5 days
Nil
Service requests, non-urgent changes
Credits applied automatically to next invoice. No claim process required.
What We Measure — and Why
We don't choose metrics that make us look good. We report the ones that tell you whether your service is actually performing.
Mean Time to Resolve
Average time from incident open to resolution. Tracked by priority tier and service line.
Mean Time to Acknowledge
How fast a ticket is picked up and acknowledged. Our commitment is clock-in, not best-effort.
First Contact Resolution
Percentage of tickets resolved on first contact without escalation. Target: >85%.
Customer Satisfaction
Post-ticket surveys scored 1–5. Reported per engineer, per team, and per service line.
Service Uptime
Monthly availability of supported systems, tracked against contractual uptime targets.
SLA Breach %
Any breach is flagged, root-caused, and reported. Chronic breach triggers a formal remediation plan.
Six Sections.
Zero Spin.
Volume & trend
Total tickets raised vs resolved, week-on-week trend, backlog age distribution, and peak demand periods.
SLA performance table
Every SLA tier reported independently: response time, resolution time, breach count, and compliance percentage.
Top 10 incident types
The most common fault categories — ranked so your team can address root causes rather than symptoms.
Engineer & site breakdown
Performance broken down by engineer, by location, and by business unit. Accountability at every level.
Breach log & root cause
Every breach documented: when, why, what happened, and what changed to prevent recurrence.
Service credit calculation
Where contractual credits apply, calculated transparently and applied to the following invoice automatically.
Alerted Before
It Becomes a Problem
Pre-breach warning
Alert fired when a ticket reaches 75% of its SLA window — before it breaches. Your SDM is notified and can intervene.
SLA breach notification
Immediate notification to your SDM and designated contact the moment an SLA is breached. No silent failures.
Volume spike detection
Unusual ticket volume in a location or category triggers an alert. Stops incident storms going unnoticed.
CSAT threshold alert
If CSAT drops below your agreed threshold, your SDM is notified and a review is triggered within 48 hours.
SLAs Are Only Useful
If Someone Is Watching Them.
Tell us what you're currently measuring and where visibility is lacking. We'll show you what a live SLA dashboard looks like for an account your size.